Public beta Free for everyone while the beta runs — every feature unlocked. Learn more ↗

Trade the past.
Sharpen the future.

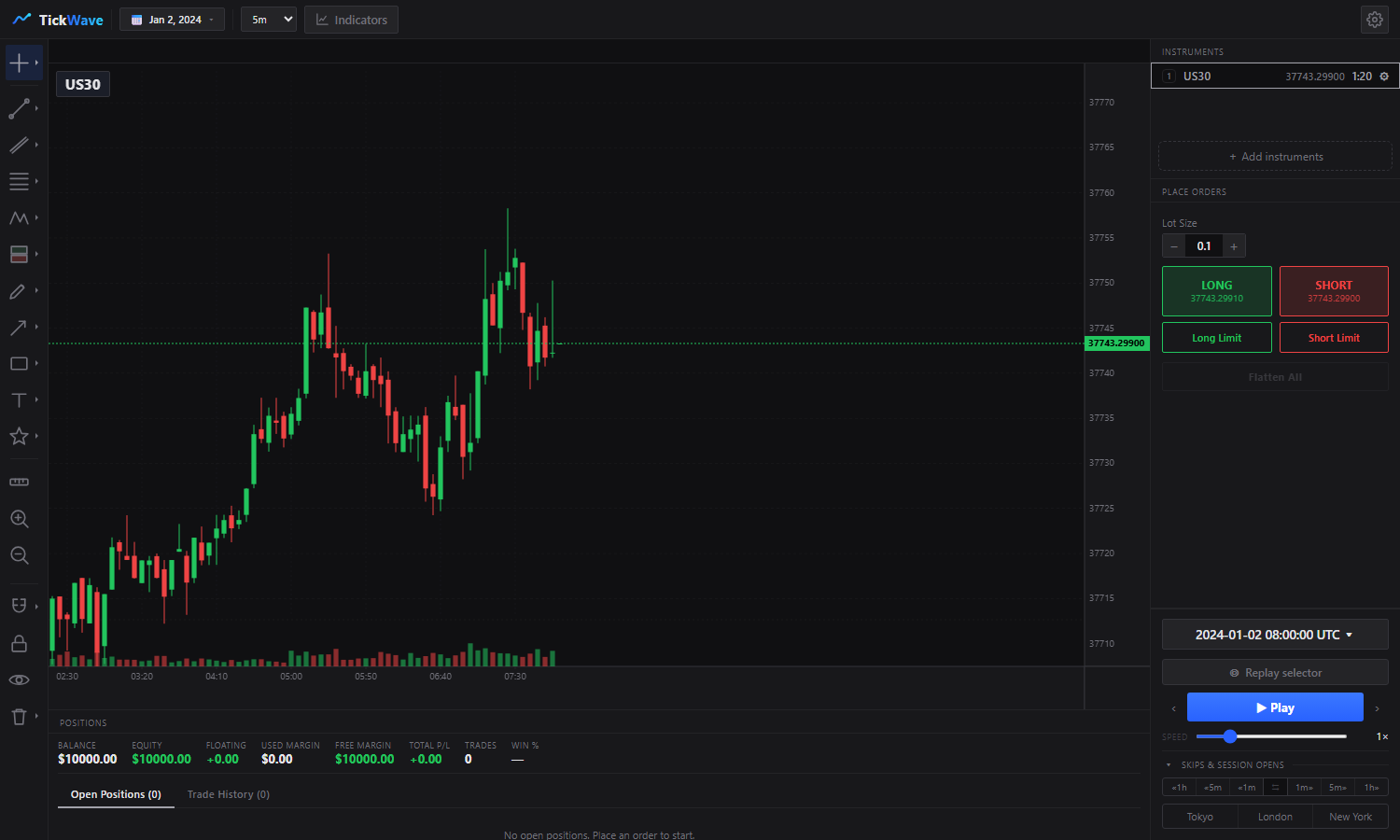
Replay real historical market data candle-by-candle, down to millisecond ticks, at 0.25× to 60× speed. Practice discretionary trading on true past price action, with no money at risk.

No card required · Real Dukascopy tick data · Forex, indices, metals & crypto

Tick-levelMillisecond precision
0.25×–60×Variable replay speed
30+Built-in indicators
1s–1MFixed timeframes
Spot & futuresTwo order tickets

The real thing

More than a chart

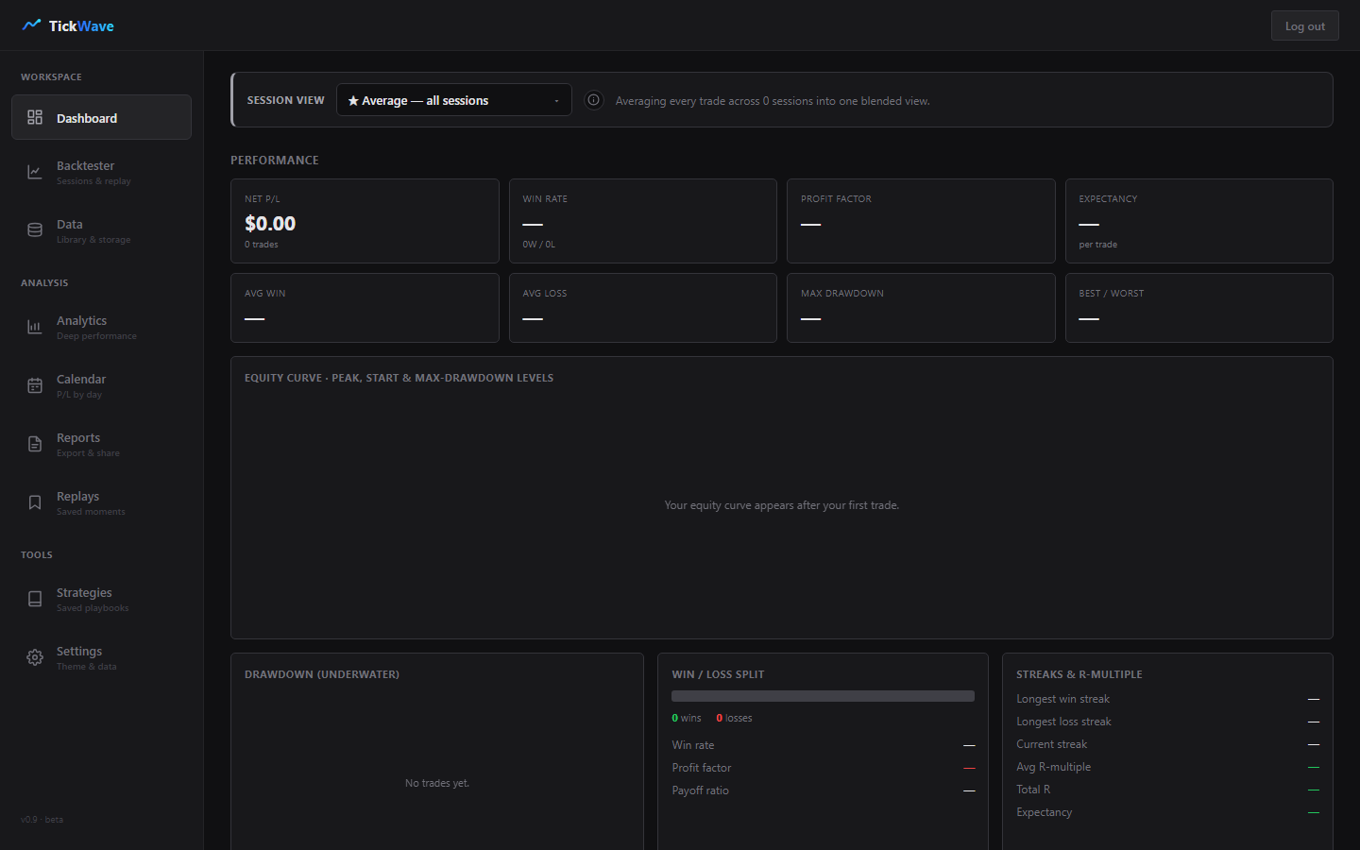
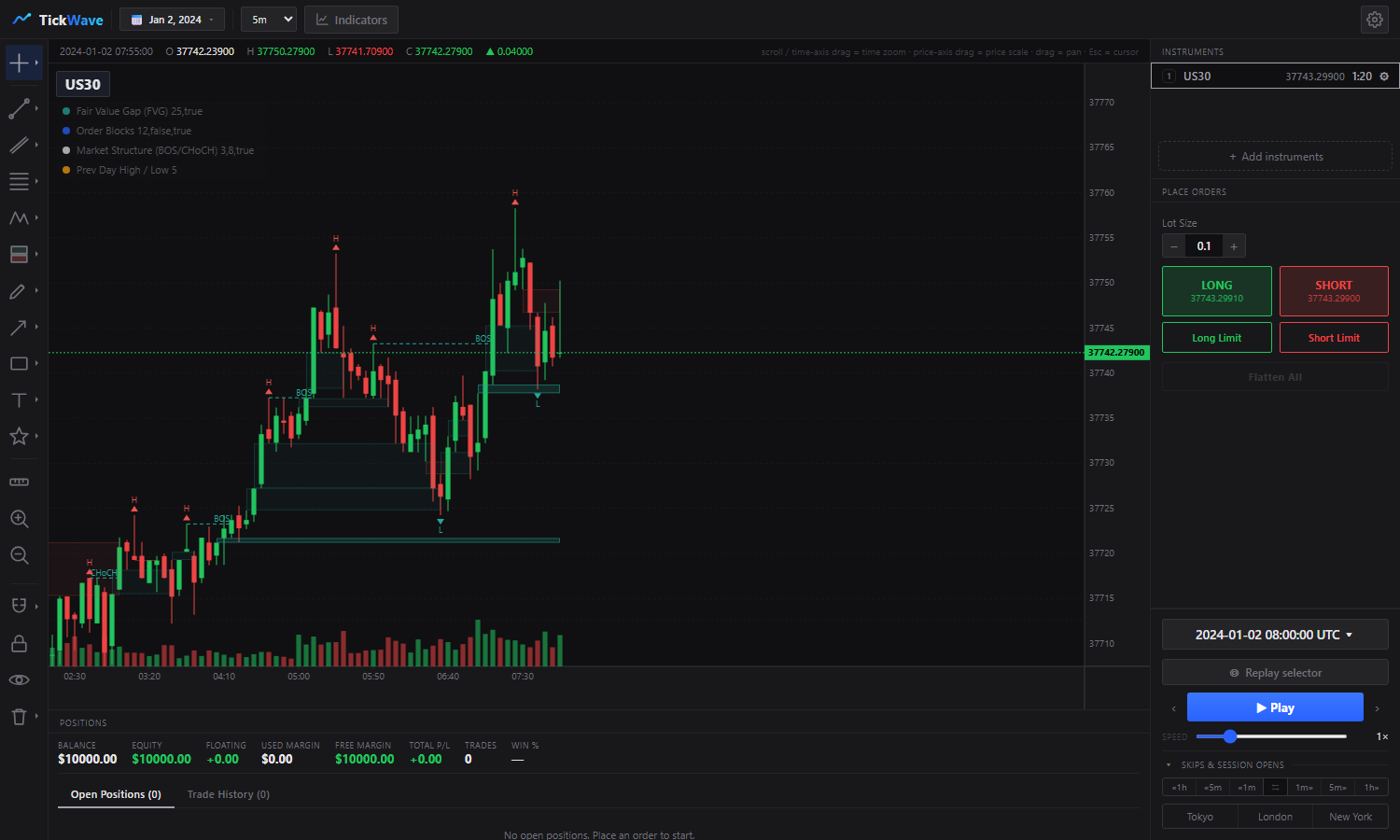
Beyond the replay chart: a full performance dashboard and smart-money tools, every bit of it drawn on real replayed price.

TickWave performance dashboard
Smart-money tools drawn on replayed price

One desk, two markets

Trade it spot or futures

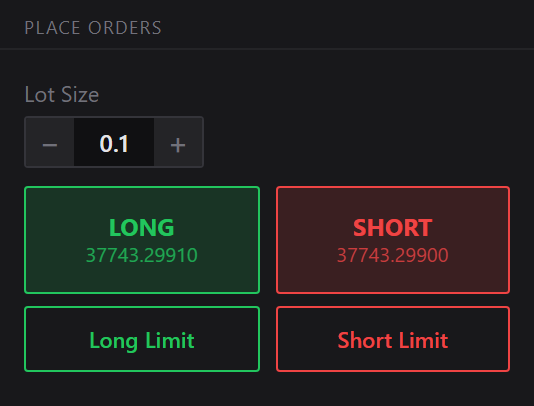
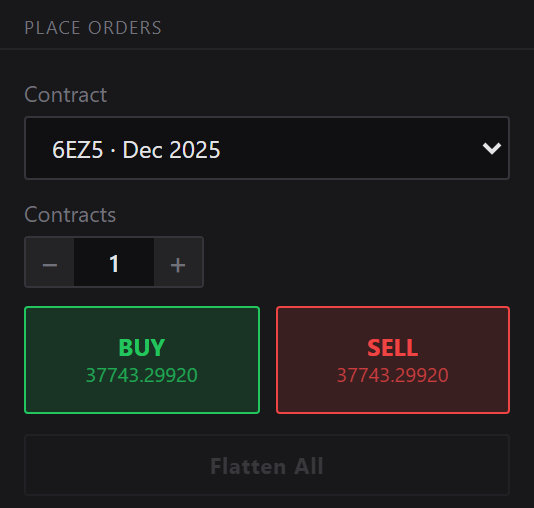
The same tick-replay engine, two order tickets. Practice cash / CFD execution, or full futures with contracts and margin, chosen per session.

Spot order ticket
Futures order ticket

Everything you need

A full trading desk, built for practice

Real execution mechanics, real charting, and real market microstructure, so screen-time actually transfers to your live account.

Replay engine

Tick-accurate replay

Pause, step, and change speed on the fly. Prices snap to real recorded ticks and are never interpolated, so what you see is exactly what happened.

  • Scrub, step & pause any bar
  • 0.25×–60× variable speed
  • Real ticks, never interpolated

Execution

Manual trade simulation

A full manual dealing desk. Place orders, manage risk, and watch your P/L move tick by tick against real historical price.

  • Market & limit orders
  • Stops / targets in pips + lot sizing
  • Live P/L, equity, win-rate & trade log

Charting

Pro-grade charting

Pan and zoom across fixed timeframes from one second to one month, with a full drawing toolbar for marking up structure.

  • Timeframes 1s → 1M
  • Trend lines, fibs, rays & brush
  • Long / short position tools

Indicators

30+ built-in indicators

Every classic study, built in and verified against standard formulas, with overlays and stacked oscillator panes included.

  • MAs, RSI, MACD, Bollinger, ATR
  • VWAP, Supertrend & more
  • Overlays + oscillator panes

Extensible

Import your own indicators

Not in the library? Bring your own. Drop custom studies straight onto the chart and run them natively on your data.

  • Import .js, .json & .csv studies
  • Runs on your replayed data
  • Build and test your own edge

Smart money

Structure tools

Fair-value gaps, order blocks and market-structure markers, drawn on real replayed price rather than a static screenshot.

  • Fair-value gaps & order blocks
  • Market-structure markers
  • Multi-pair on one shared clock

Three steps

From raw data to real reps

No accounts to fund, no simulators pretending. Load real history, replay it live, and study every decision.

01

Load your data

A lightweight local helper fetches real Dukascopy tick data right on your own machine. Pick an instrument and date range, and TickWave streams genuine bid/ask ticks into the chart.

02

Replay & execute

Press play and watch price unfold candle-by-candle at 0.25×–60×. Place market and limit orders, set stops and targets, and manage the trade live.

03

Journal & analyze

Every fill lands in your trade log. Re-watch entries as session replays, review the calendar, and flip instruments to test the next idea instantly.

Session replays & analytics

Study every trade like game tape

Re-watch any trade from 30 seconds before entry to 30 seconds after exit with live P/L. A calendar view surfaces per-day performance, and multi-pair support lets you flip instruments instantly.

64.2%Win rate
+$3,847Net P/L
218Trades logged
Multi-pairInstruments
Session replay with live P/L

Put in the reps the market rewards

Load real history, replay it tick-by-tick, and build discretionary skill on price action that actually happened. Free to start, right in your browser.

Free during the open beta · No card required · Real tick data · Forex & futures